- Published on
Setting Up a Debug Environment for QEMU PCI Device Exploitation
- Authors

- Name
- Varik Matevosyan
- @D4RK7ET
Setting Up a Debug Environment for QEMU PCI Device Exploitation
Recently I solved the NFTDRM PWN challenge on HackTheBox - a QEMU escape ranked at insane difficulty level. The exploit itself deserves its own post. This one is specifically about setting up a debug environment that makes iterating on the exploit fast and gives you proper observability into what's happening on both sides of the VM (guest and host).
Thanks to the challenge authors, it was a great challenge and I learned a lot.
My Setup
My main machine is a MacBook with M3 (ARM), but most CTF challenges are x86_64. So the first step was spinning up an x86_64 Ubuntu 24.04 server VM inside UTM. Server edition because the CPU is being fully emulated with no GPU acceleration - a desktop UI would just be sluggish and who ever needs UI for pwning :).
I then set up file sharing between the host and the VM so I can edit code locally in my editor and compile/debug inside the VM. SSH key, openssh server, port forwarding 22→1222:
ssh -p 1222 [email protected]
Understanding the Challenge
The challenge archive contains a Dockerfile, a patched QEMU binary, and initramfs.cpio.gz. The goal is to escape the QEMU VM by exploiting a custom PCI device emulated by QEMU itself - gaining RCE on the host.
PCI Devices and MMIO in QEMU
QEMU can emulate custom PCI devices entirely in software. The guest OS discovers them through the PCI bus (lspci) like any real hardware. PCI devices expose their registers through BARs (Base Address Registers) - memory regions that get mapped into the guest's physical address space. The guest reads and writes these regions (MMIO) to issue commands and exchange data with the device.
For bulk data transfer, the device uses DMA: the guest allocates a physically contiguous buffer, hands the guest-physical address to the device, and the device reads or writes that memory directly. This is how the exploit eventually reaches QEMU host memory.
The NFTDRM Device
After some time with lspci and setpci inside the VM to understand how the device announces itself on the bus, I mapped out its MMIO interface - one BAR (BAR0), page-sized, with registers at specific byte offsets:
#define OFF_ERROR    0x00
#define OFF_COMMAND  0x01
#define OFF_RETVAL   0x02
#define OFF_STATE    0x04
#define OFF_ENC_BUF  0x08
#define OFF_DEC_BUF  0x10
#define OFF_XCHG_BUF 0x18
#define OFF_ENC_SIZE 0x20
#define OFF_DEC_SIZE 0x22
Write a command byte to OFF_COMMAND, set up DMA buffer addresses at OFF_ENC_BUF/OFF_DEC_BUF, check the result at OFF_ERROR and OFF_RETVAL. The device implements an encrypted content protection scheme with key exchange, AES operations, and an internal queue for managing encrypted data.
Writing a Kernel Driver
To talk to the device from userspace exploit code, I needed BAR0 mapped into a userspace process. The cleanest approach is a small kernel module that exposes BAR0 through mmap on a character device.
The module:
- On
probe, callspci_set_master(enables bus mastering so the device can perform DMA), then maps BAR0 withpcim_iomap - Registers a character device (major 64,
nftdrm) - On
mmap, usesio_remap_pfn_rangeto map the PCI resource's physical address into the user's VMA
After loading the module, we expose it:
insmod nftdrm.ko
mknod /dev/nft c 64 0
And from the exploit:
int fd = open("/dev/nft", O_RDWR);
void *bar0 = mmap(0, PAGE_SIZE, PROT_READ | PROT_WRITE, MAP_SHARED, fd, 0);
Now bar0 is a direct bridge into the device. Some simple helpers to read device state:
uint8_t read_error(void *bar) { return *(uint8_t *)(bar + OFF_ERROR); }

uint8_t read_state(void *bar) { return *(uint8_t *)(bar + OFF_STATE); }

uint16_t read_retval(void *bar) { return *(uint16_t *)(bar + OFF_RETVAL); }

void print_bar_state(void *bar, const char *label) {
  uint8_t err = read_error(bar);
  uint8_t state = read_state(bar);
  uint16_t retval = read_retval(bar);
  printf("%s: err=0x%x|state=0x%x|retval=0x%x\n", label, err, state, retval);
}
Write to bar0 + OFF_COMMAND to trigger a command, Write to bar0 + OFF_COMMAND to trigger a command, print_bar_state to check the result, set up DMA buffer addresses at OFF_ENC_BUF/OFF_DEC_BUF, etc. Much cleaner than raw setpci and lets the exploit code be written in plain C.
Building the Driver and Exploit
The kernel module must be compiled against the exact kernel version running inside QEMU. The challenge notes told us which version it was. I used a build container that installs the matching linux headers and outputs both the .ko and the static exploit binary:
Dockerfile:
FROM debian:bullseye

RUN apt-get update && apt-get install -y \
    build-essential bc bison flex \
    libssl-dev libelf-dev libncurses-dev \
    kmod gcc-10 \
    && rm -rf /var/lib/apt/lists/*

COPY headers/*.deb /tmp/
RUN dpkg -i /tmp/linux-kbuild-5.10_5.10.106-1_amd64.deb \
    && dpkg -i /tmp/linux-headers-5.10.0-13-common_5.10.106-1_all.deb \
    && dpkg -i --force-depends /tmp/linux-headers-5.10.0-13-amd64_5.10.106-1_amd64.deb \
    && rm -f /tmp/*.deb

WORKDIR /build/driver
COPY driver/Makefile driver/nftdrm.c driver/exploit.c ./
COPY src/ecdh.c src/ecdh.h src/aes.c src/aes.h ./

RUN make -C /lib/modules/5.10.0-13-amd64/build M=$(pwd) modules
RUN gcc -static -o exploit exploit.c ecdh.c aes.c

CMD ["sh", "-c", "cp -v /build/driver/nftdrm.ko /build/driver/exploit /output/"]
Makefile:
obj-m += nftdrm.o

all: modules exploit

modules:
	make -C /lib/modules/$(shell uname -r)/build M=$(PWD) modules

exploit: exploit.c
	$(CC) -static -o exploit exploit.c

clean:
	make -C /lib/modules/$(shell uname -r)/build M=$(PWD) clean
	rm -f exploit
The output - nftdrm.ko and the static exploit binary - needs to be packed into the initramfs before each run.
Packing the initramfs
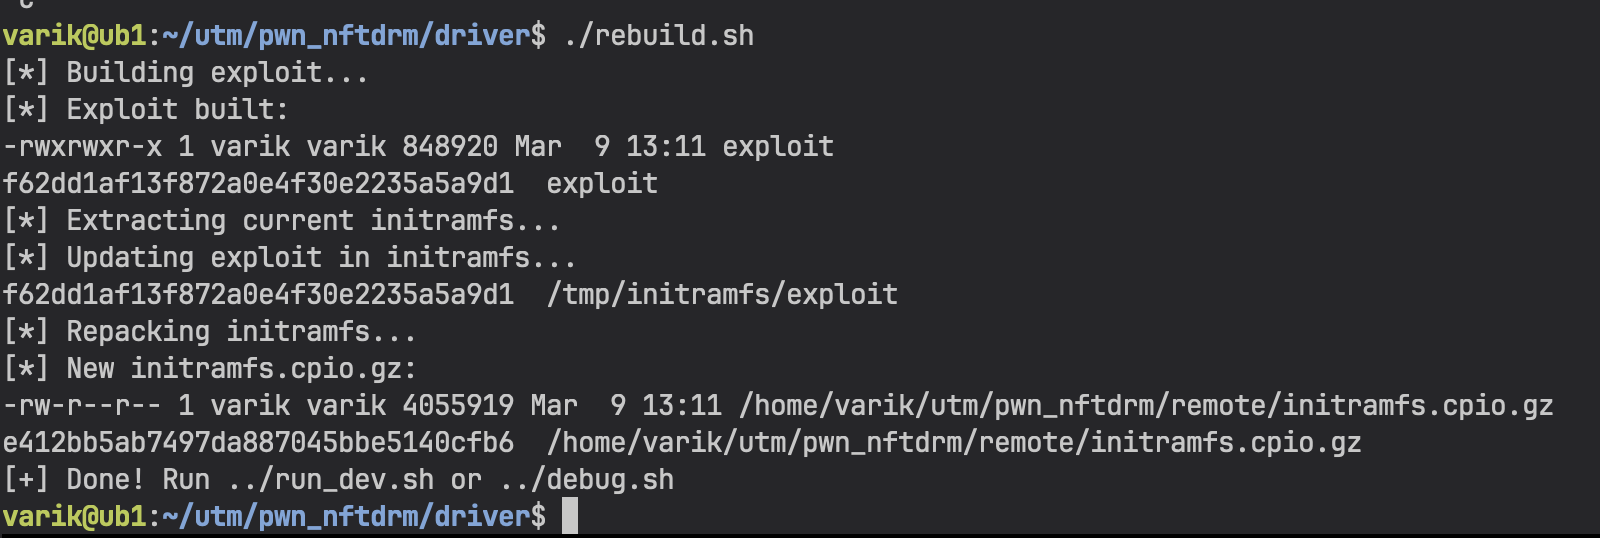
The initramfs is just a cpio archive. Unpack it, drop in the new files, repack. I automated this into a rebuild script:
driver/rebuild.sh:
#!/bin/sh
set -e

SCRIPT_DIR="$(cd "$(dirname "$0")" && pwd)"
ROOT_DIR="$(dirname "$SCRIPT_DIR")"

echo "[*] Building exploit..."
cd "$SCRIPT_DIR"
gcc -static -o exploit exploit.c ../src/ecdh.c ../src/aes.c -I ../src/
ls -la exploit && md5sum exploit

echo "[*] Extracting initramfs..."
rm -rf /tmp/initramfs && mkdir -p /tmp/initramfs
cd /tmp/initramfs
zcat "$ROOT_DIR/remote/initramfs.cpio.gz" | cpio -idm 2>/dev/null

echo "[*] Updating exploit..."
cp "$SCRIPT_DIR/exploit" /tmp/initramfs/exploit
md5sum /tmp/initramfs/exploit

echo "[*] Repacking..."
cd /tmp/initramfs
find . -print | cpio -o -H newc 2>/dev/null | gzip > "$ROOT_DIR/remote/initramfs.cpio.gz"

echo "[+] Done!"
Modifying the Init Script
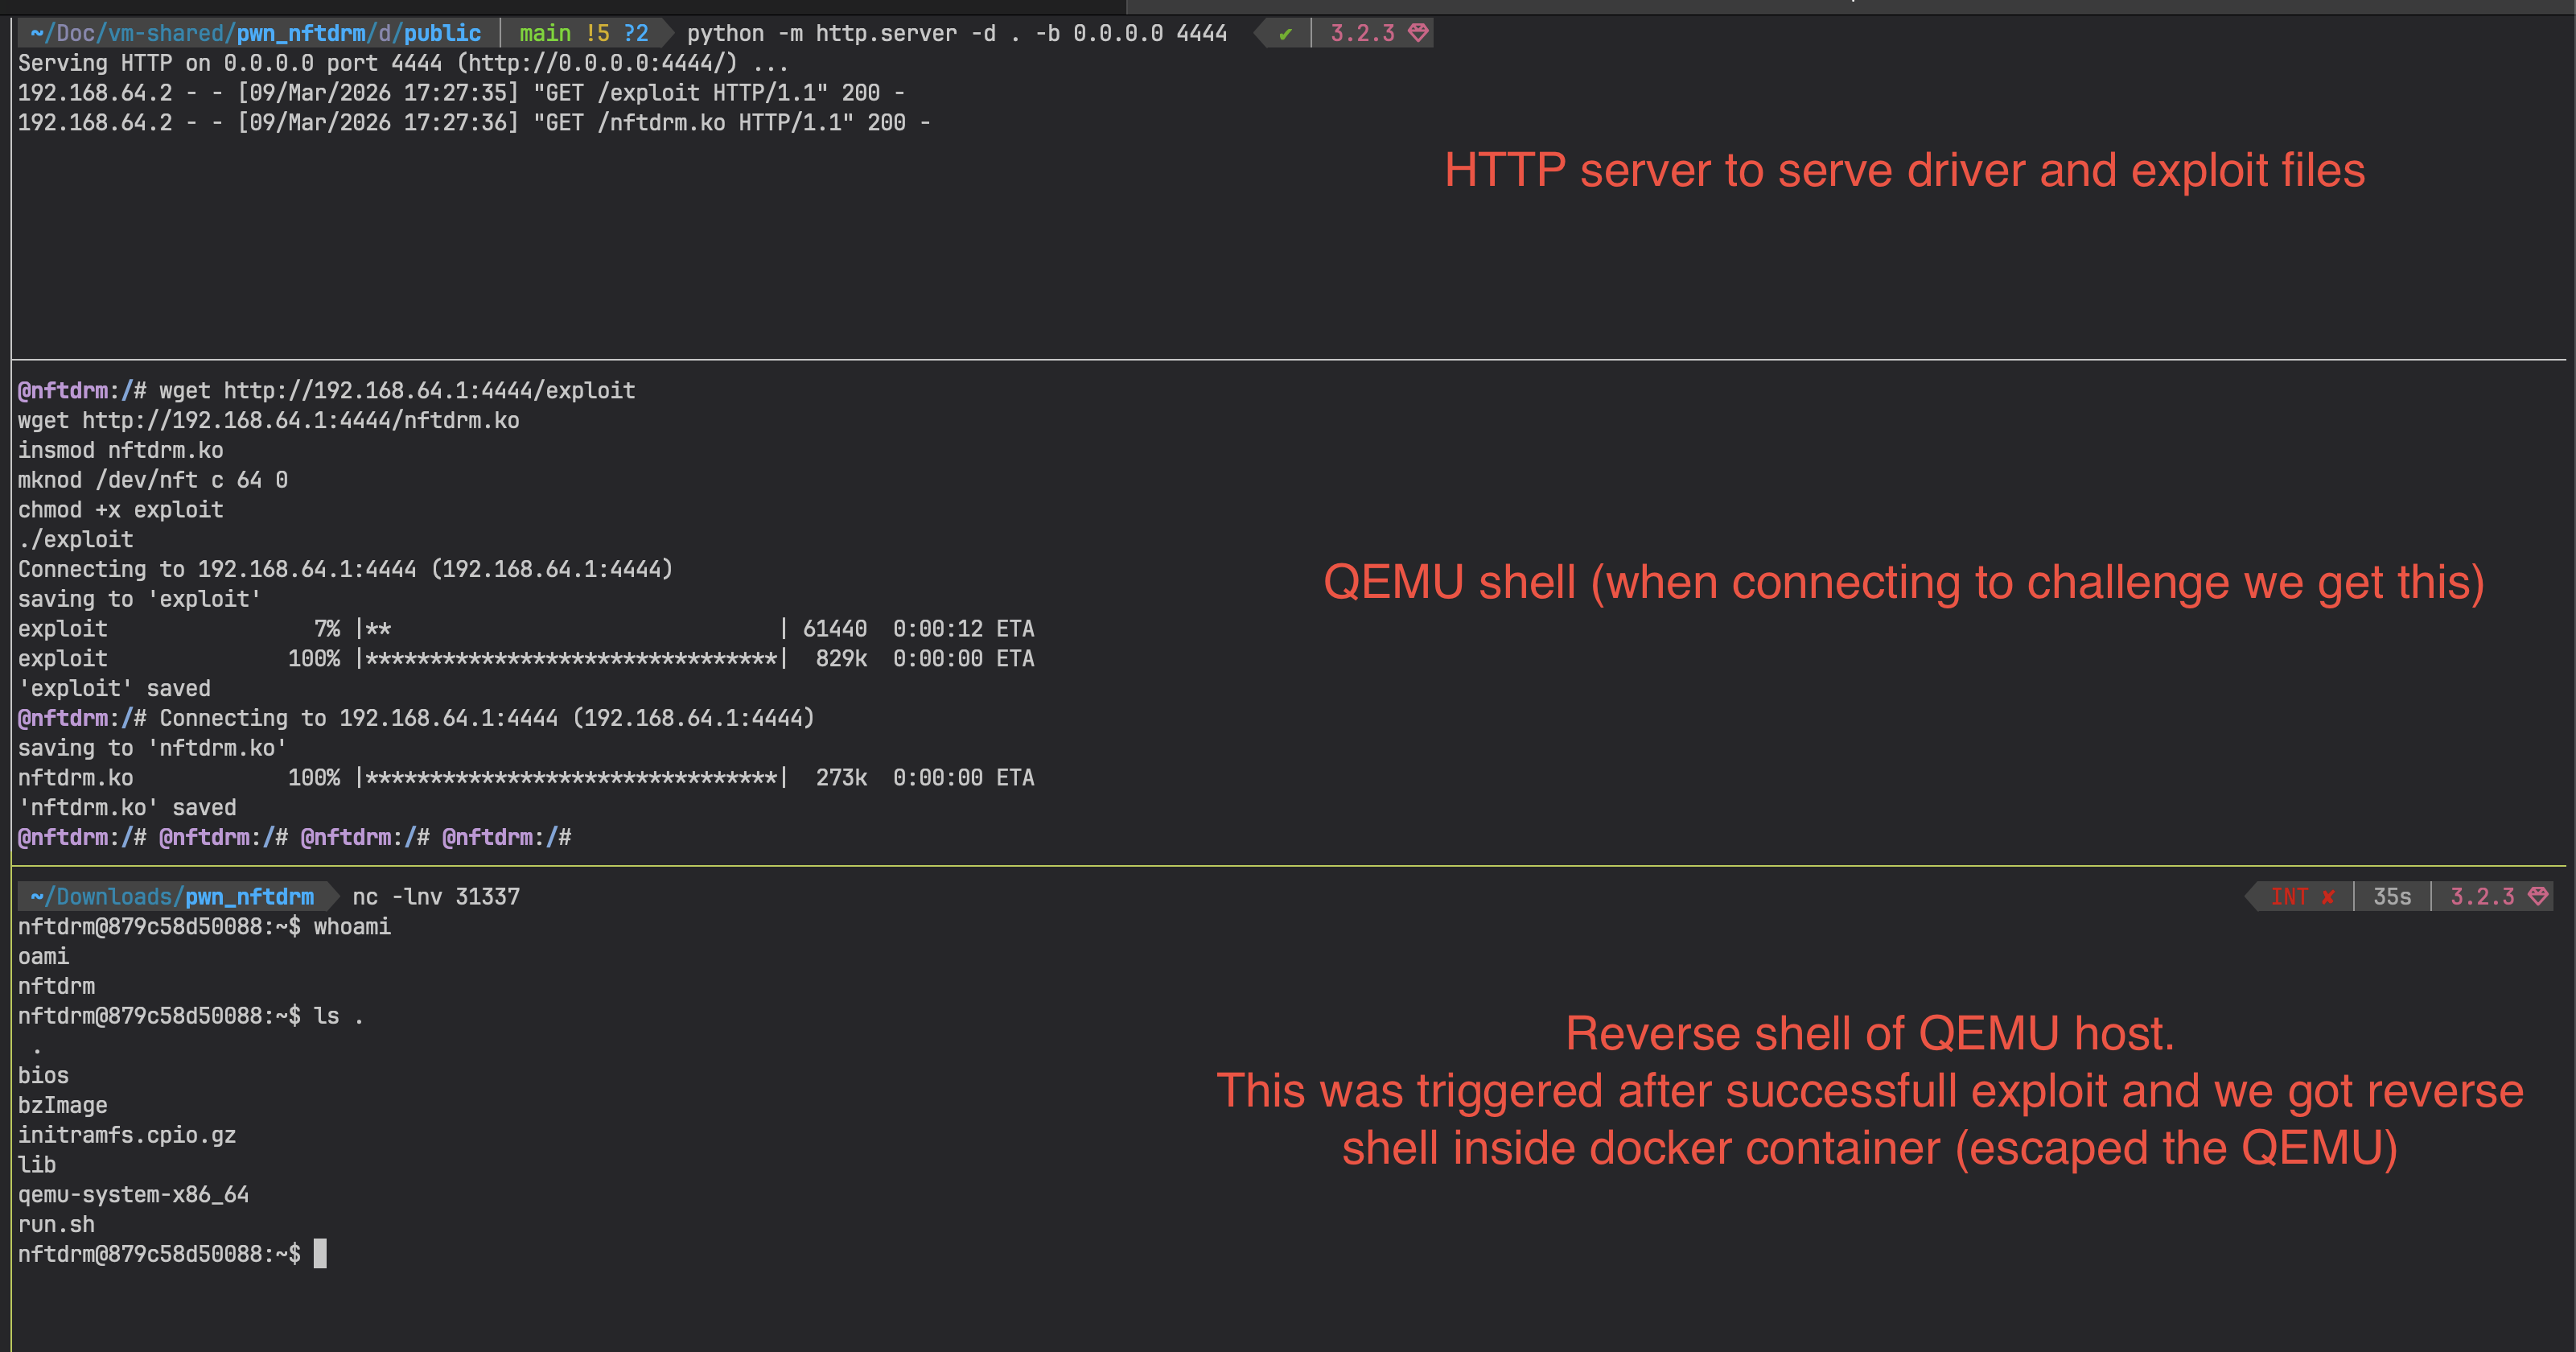
The original /init runs a nc listener on port 1337 - that's the CTF-mode reverse shell with a session timeout. For local debugging that's useless. I needed two things: the driver loaded and device node created automatically on boot, and an interactive shell on the serial console so I can run the exploit directly.
The relevant changes at the end of /init:
# Original - CTF mode, reverse shell:
setsid cttyhack nc -lp 1337 -e /bin/sh -c "/bin/sh -i 2>&1"
umount /proc
umount /sys
poweroff -d 1 -n -f

# Debug mode - interactive serial console, driver pre-loaded:
insmod nftdrm.ko
mknod /dev/nft c 64 0
exec setsid cttyhack /bin/sh -l 0</dev/console 1>/dev/console 2>&1
exec setsid cttyhack replaces the init process with a shell that has a proper controlling TTY on the serial console. Without cttyhack, job control doesn't work correctly and signals misbehave inside the VM - you'll notice things like Ctrl+C not working as expected.
After making changes to /init, repack the initramfs the same way as above (or just include it in rebuild.sh).
Running QEMU Under pwndbg
The challenge provides the QEMU binary with symbols intact - a huge win for debugging. We run it directly under pwndbg.
debug.sh:
#!/bin/sh
cd "$(dirname "$0")/remote"

SCRIPT_DIR="$(cd "$(dirname "$0")" && pwd)"

cat > /tmp/nftdrm_debug.py << 'PYEOF'
import gdb

class MmioReadBP(gdb.Breakpoint):
    def __init__(self, spec):
        super().__init__(spec)
    def stop(self):
        return True

MmioReadBP("pci_nftdrm_mmio_read")
PYEOF

cat > /tmp/gdbinit << EOF
set disable-randomization off
set substitute-path ../hw/misc/NFTDRM $SCRIPT_DIR/src
source /tmp/nftdrm_debug.py
EOF

exec pwndbg -x /tmp/gdbinit --args ./qemu-system-x86_64 \
    -nographic \
    -nodefaults \
    -monitor /dev/null \
    -chardev stdio,id=char0,mux=off,signal=on \
    -serial chardev:char0 \
    -m 128 \
    -L ./bios \
    -device nftdrm \
    -kernel bzImage \
    -initrd initramfs.cpio.gz \
    -append "console=ttyS0 loglevel=3 oops=panic panic=-1 pti=on kaslr quiet" \
    -cpu qemu64,+smep,+smap \
    -no-reboot
A few things worth pointing out:
set disable-randomization off - keeps ASLR enabled. You want to test the exploit against the real hardened environment, not a relaxed local environment. Disabling ASLR can help to skip pointer leaking and do that part later.
set substitute-path ../hw/misc/NFTDRM $SCRIPT_DIR/src - the QEMU binary was compiled with source paths pointing to the original build machine's directory structure. This remaps those to our local src/ so GDB can show the device source code inline while stepping through it. Compiler optimizations mean the source mapping isn't perfect (instructions don't always correspond line-for-line), but it's still useful context to have without switching windows.
source /tmp/nftdrm_debug.py - pre-registers a breakpoint on pci_nftdrm_mmio_read via the GDB Python API. You can add more breakpoints here, make them conditional, or add custom stop handlers. Much less typing than setting them up manually every session.
Serial I/O wiring: -nographic -nodefaults -chardev stdio,id=char0,mux=off,signal=on -serial chardev:char0 routes the VM's serial console directly to the terminal pwndbg is running in. QEMU boot output, the kernel log, and the root shell we set up in /init all appear in the same terminal. When the VM boots and drops into a shell, you type commands directly there while pwndbg is ready on the host side.
With this setup: r in pwndbg launches QEMU, the VM boots in a few seconds, you land in a root shell with the driver already loaded and /dev/nft ready. Running ./exploit inside the VM will hit the breakpoints set in the Python script.
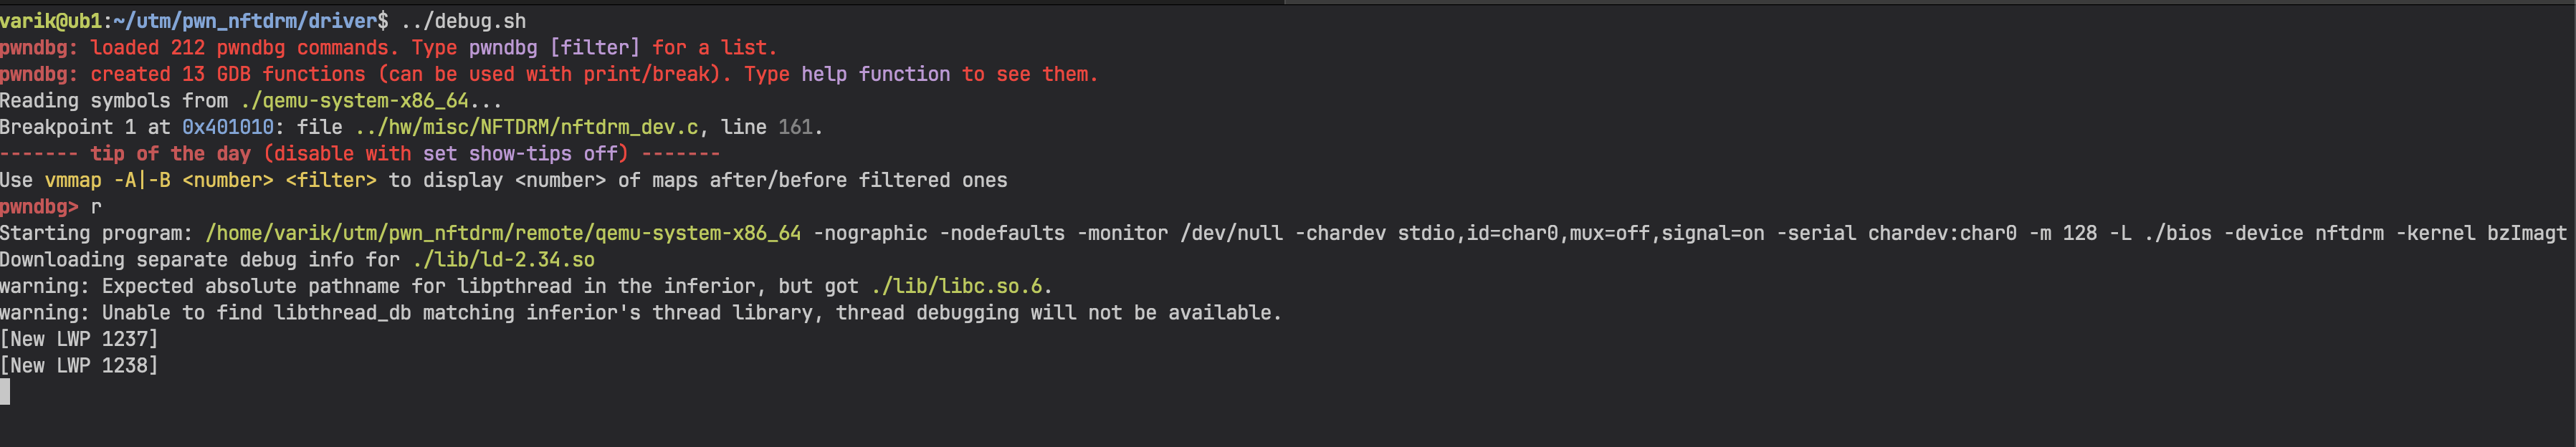
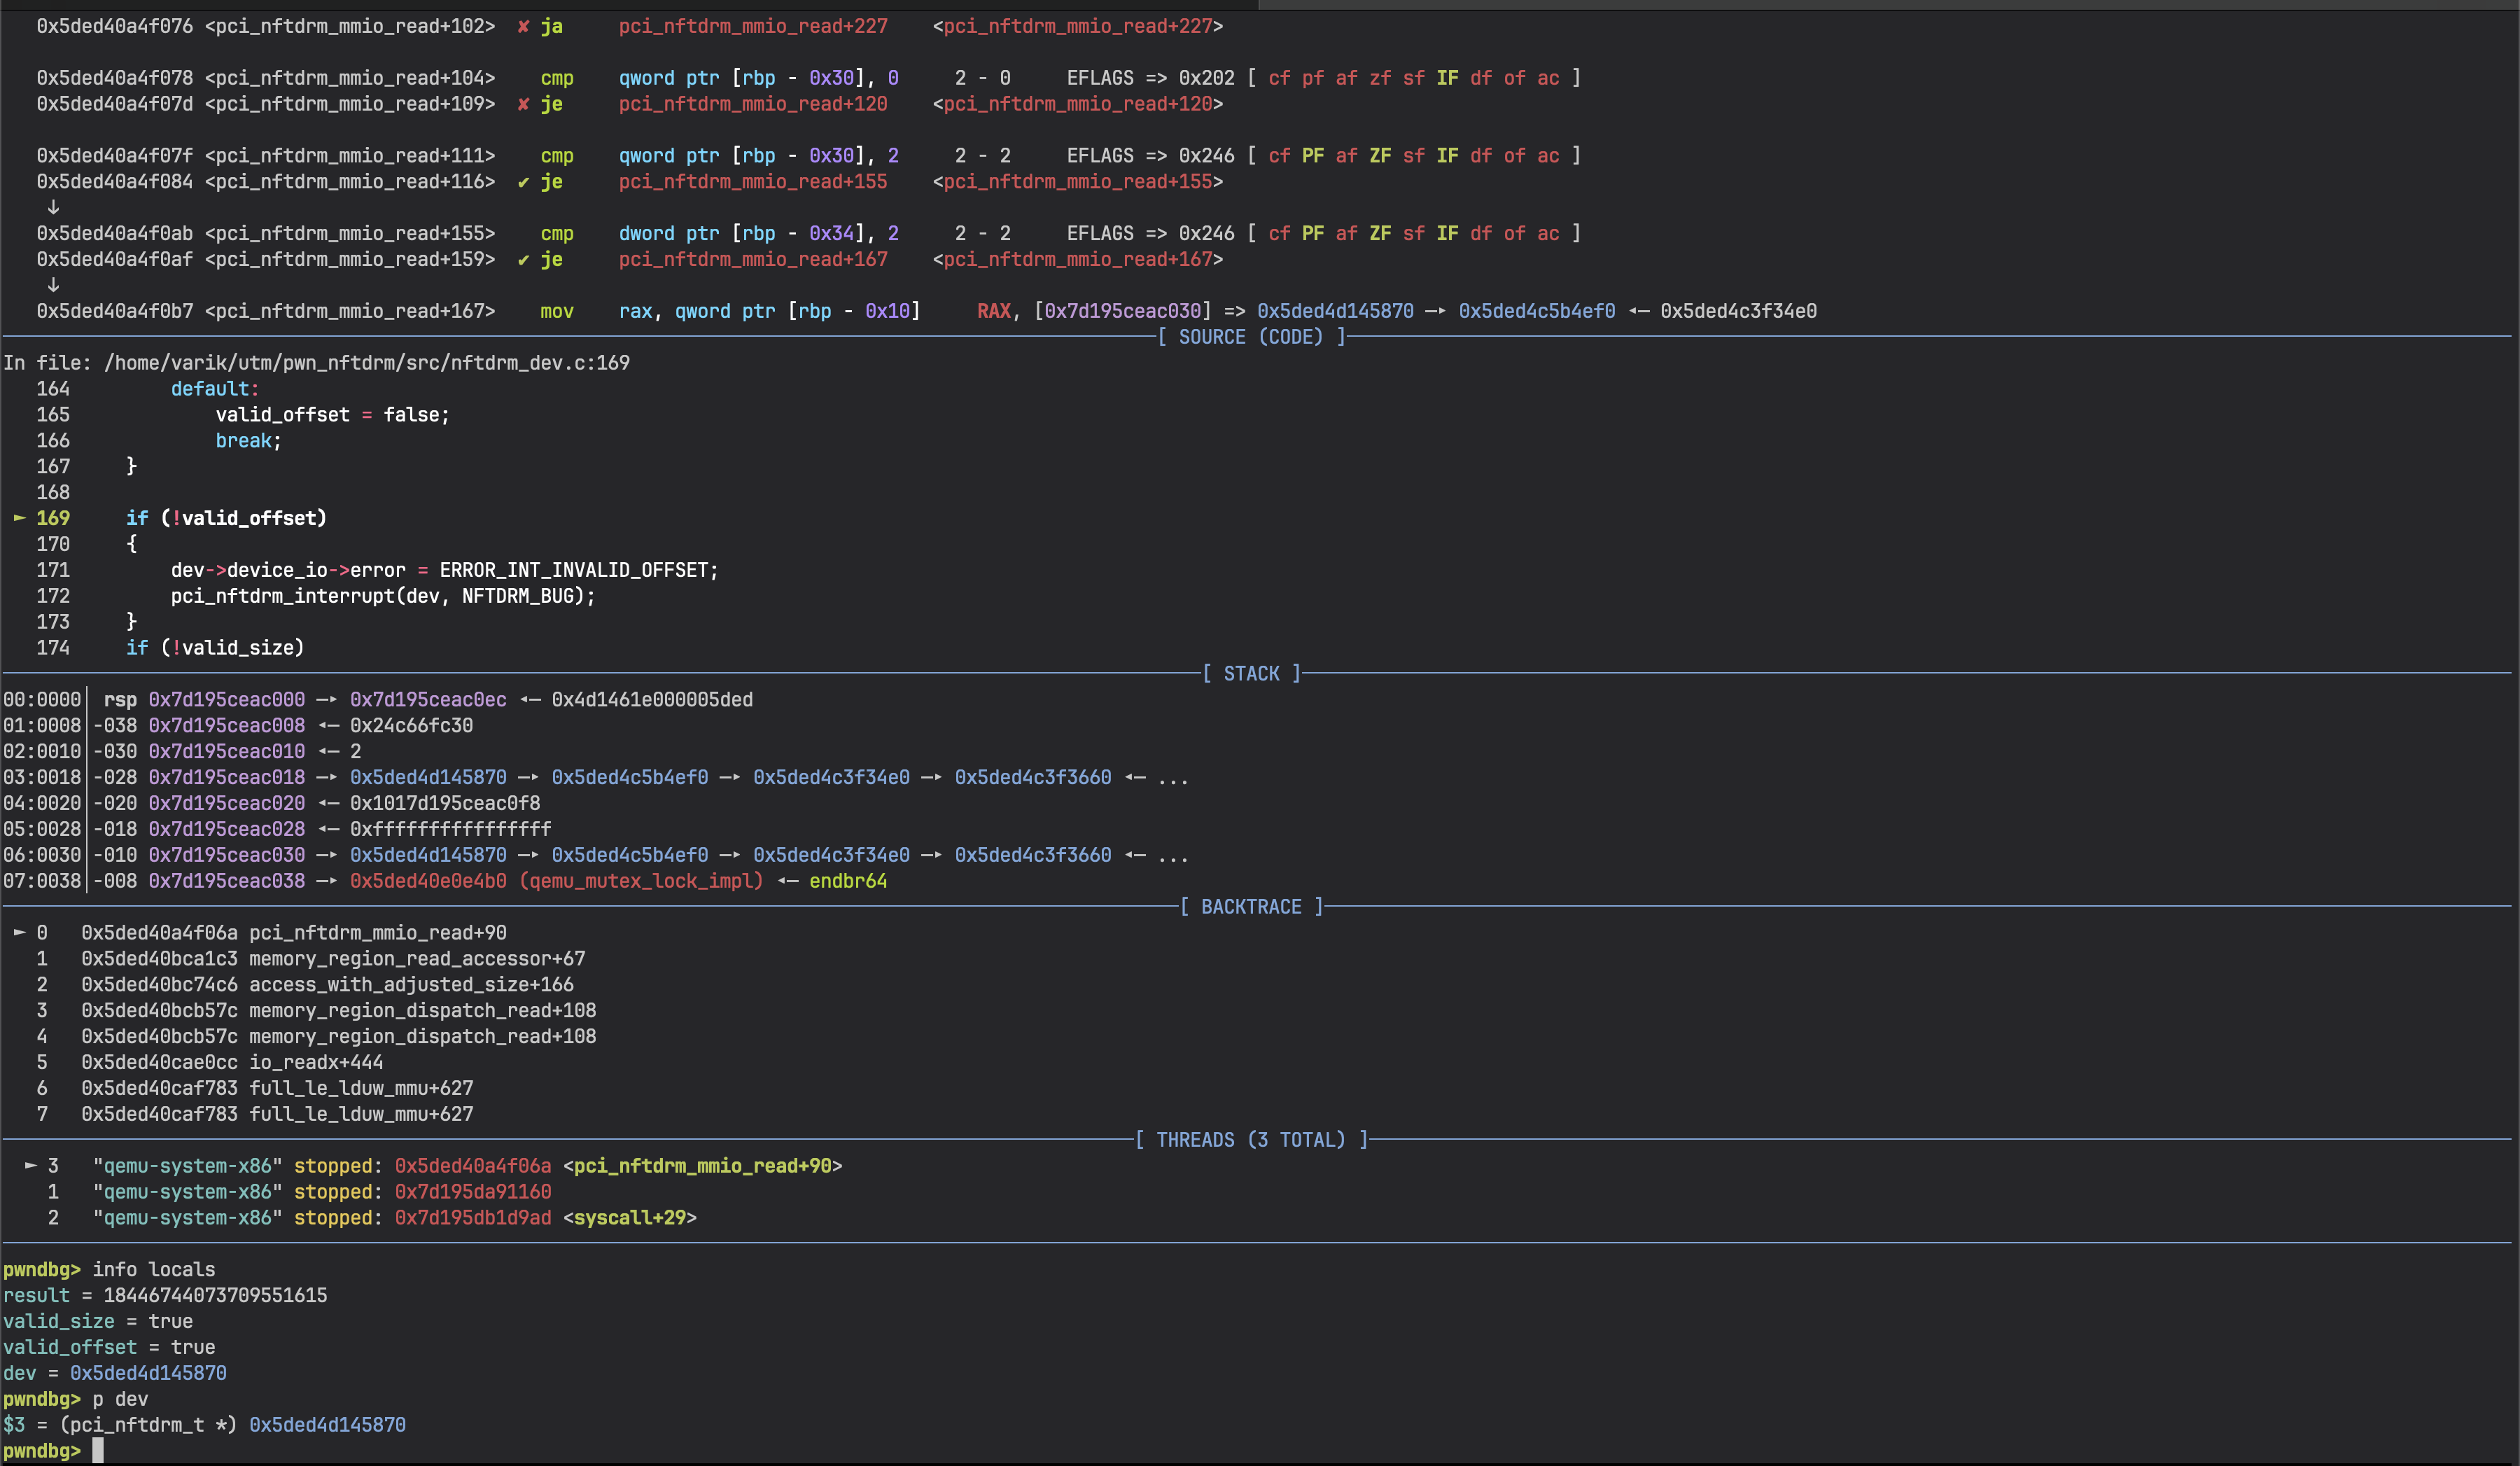
For example, with a breakpoint on pci_nftdrm_mmio_read, we can step through the device code and inspect registers/memory on the host side while the exploit runs in the guest:
The Dev Loop
The full cycle from code change to running inside the debugger is:
- Edit exploit code on Mac
- UTM VM
./driver/rebuild.sh- recompiles, repacks initramfs - UTM VM -
./debug.shthenrin pwndbg - QEMU boots with the updated binary - Run
./exploitinside the QEMU shell, inspect in pwndbg
The repack takes a couple of seconds. Fast enough to not be annoying.
But the ./debug.sh can take up to a minute or more on emulated CPU under UTM, so re-read your exploit for typos before debugging it to save time ;)
After a few sleepless nights I finally got out of the VM and read the flag.