- Published on
V8 Exploitation: From Libc Pwn to Browser Bugs
- Authors

- Name
- Varik Matevosyan
- @D4RK7ET
V8 Exploitation: From Libc Pwn to Browser Bugs
For the past few years I've been doing pwn challenges - starting from basic stack overflows, progressing through libc heap exploitation, writing a CheatEngine clone in Rust, and prototyping an eBPF-based record-replay tool that required bypassing vDSO. I felt fairly comfortable with systems programming and userspace exploitation.
But challenges like QEMU escape or browser exploitation always seemed like a different league. Something I wasn't "ready for yet." That feeling created an artificial barrier - I kept telling myself I needed more preparation before even attempting them.
Then I decided to just try. I picked up a QEMU escape challenge from HTB and after some sleepless nights, pwned it. That was the moment the barrier started cracking. If QEMU escape was doable, maybe V8 wasn't that far off either.
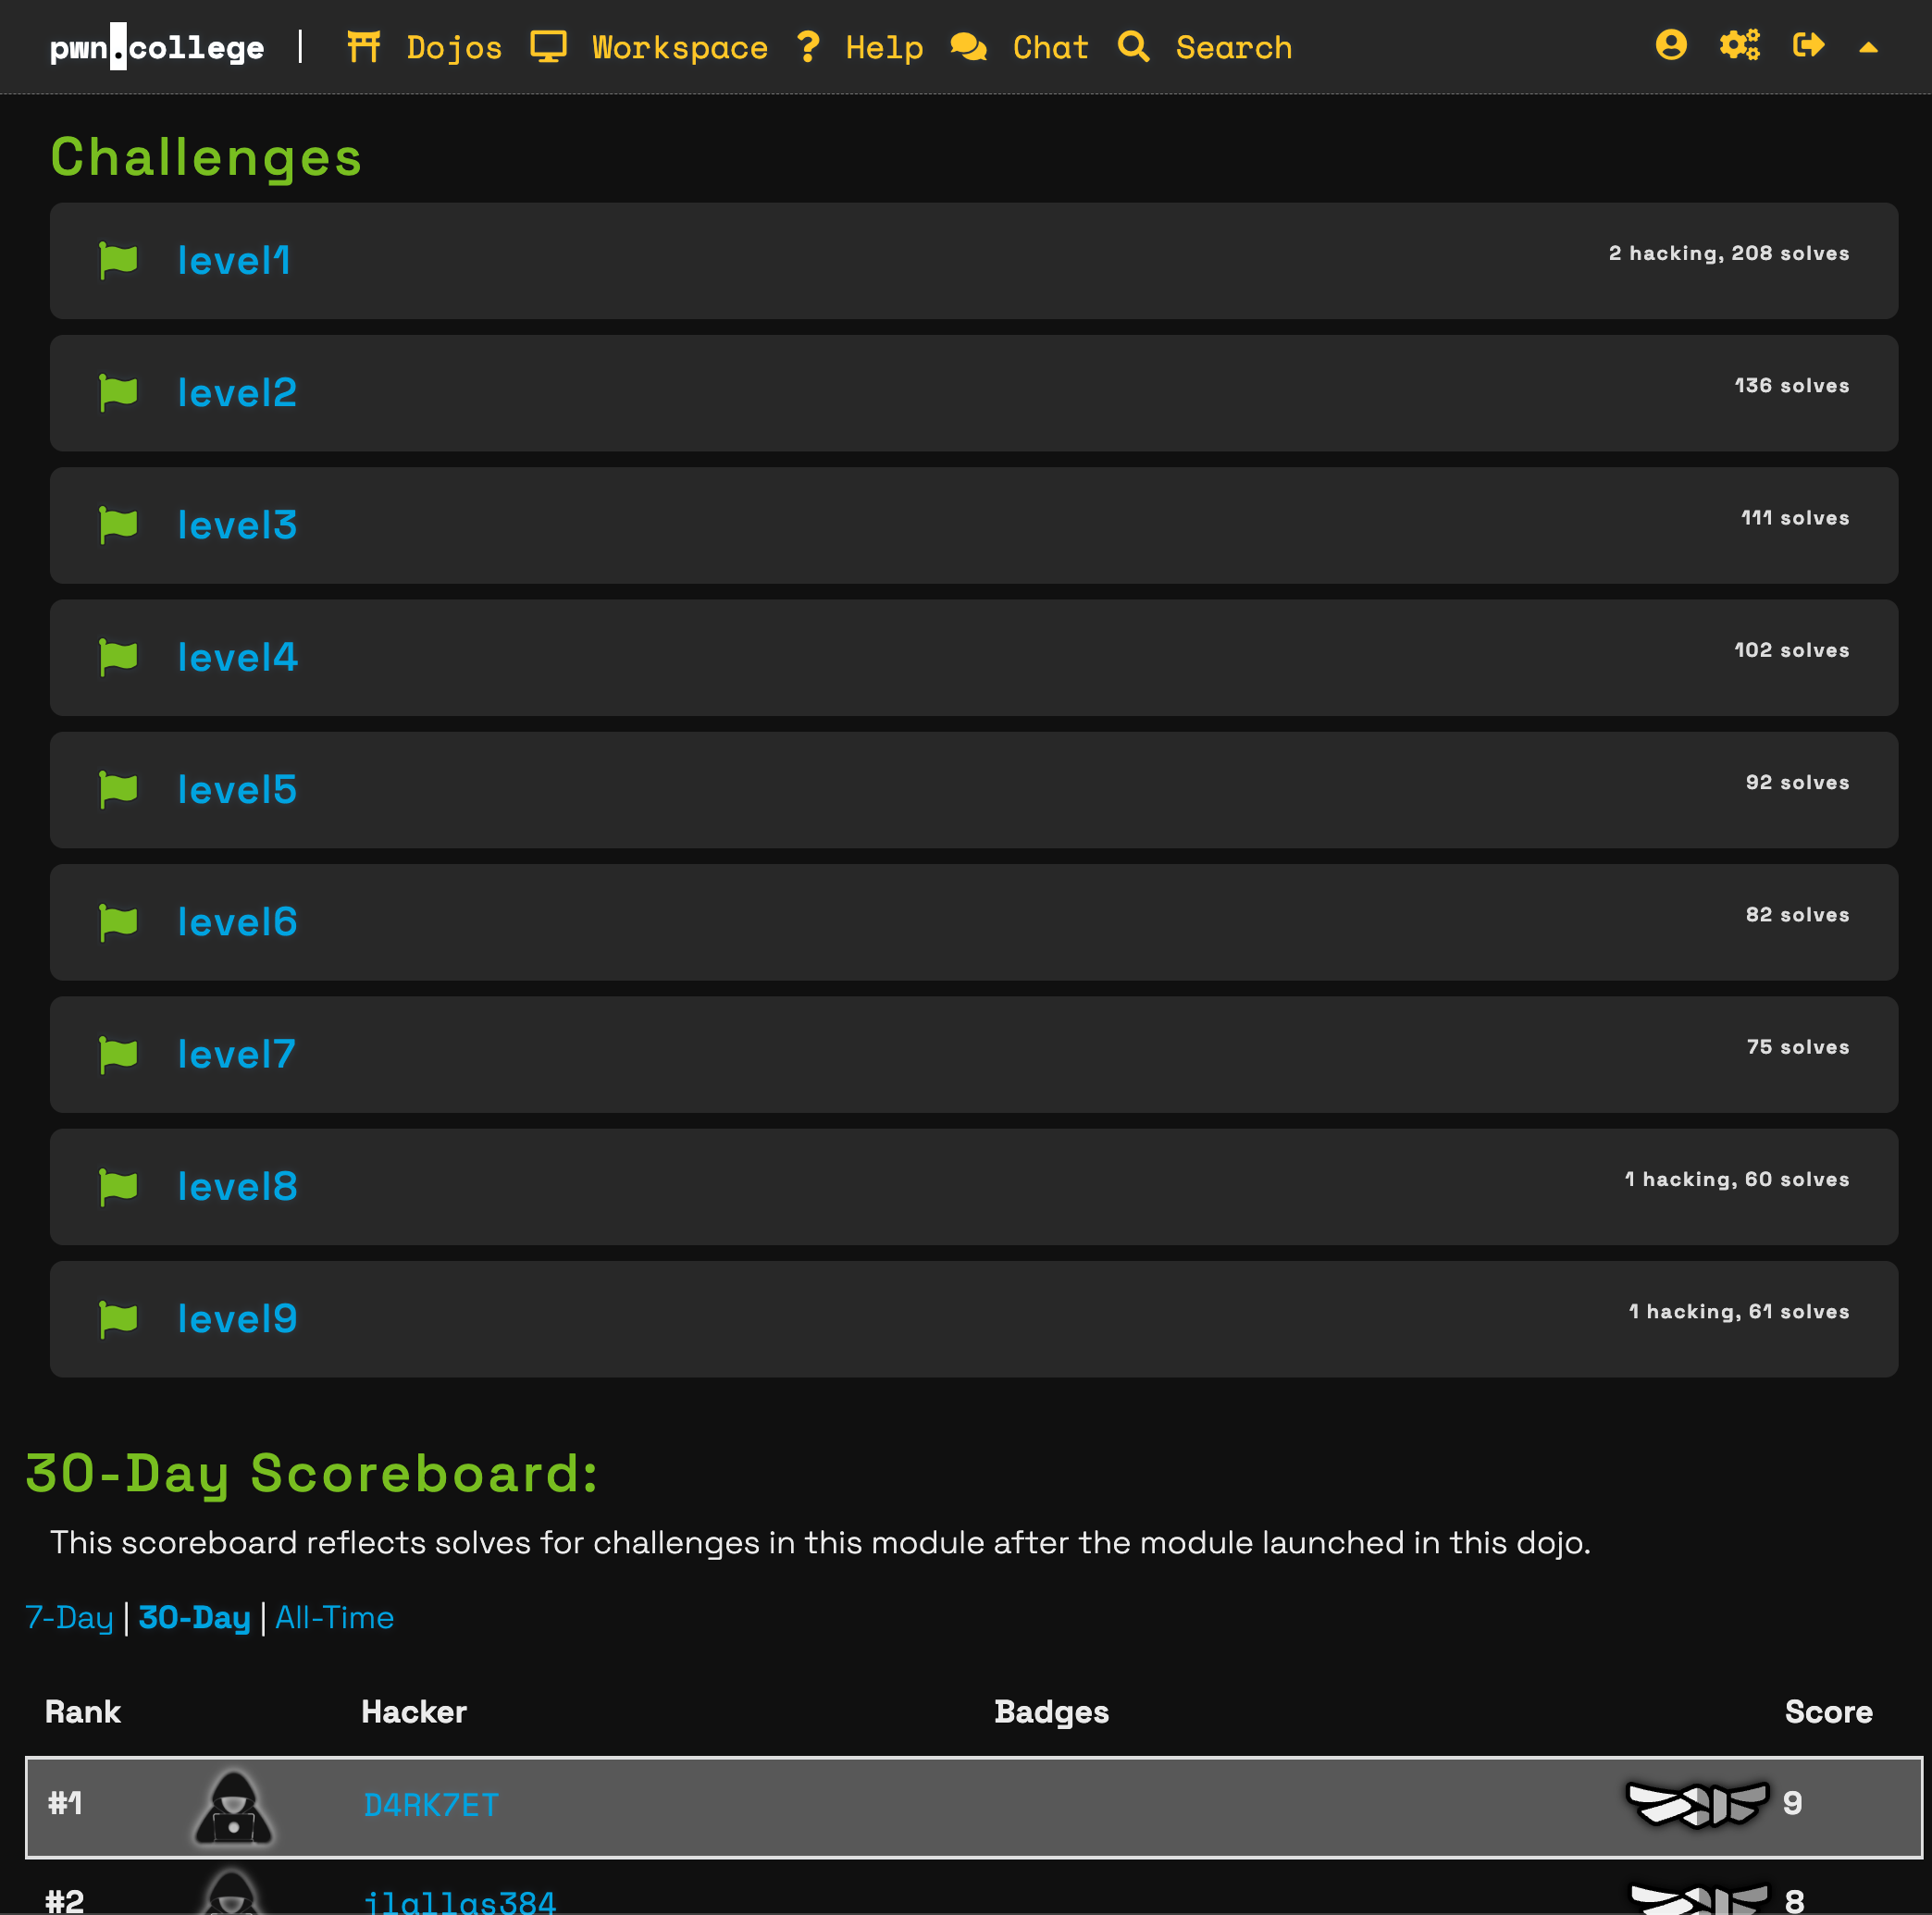
So I went for it. I completed all 9 levels of V8 exploitation challenges on pwn.college, from direct Wasm shellcode execution to JIT bugs and sandbox escape.
Thanks to the challenge authors and the pwn.college platform - the challenges were well-structured, progressively building on each other, and genuinely fun to work through.
This post isn't a writeup of those challenges (pwn.college forbids sharing solutions). Instead, it's the guide I wish I had when starting out - the mental model, the tooling, and the core primitives that make V8 exploitation click if you're coming from classic libc pwn.
Research First, Then Act
From my experience, jumping straight into a challenge is always worse than spending some time on research first. V8 is a massive codebase with decades of design decisions baked in. Going in blind means you'll waste hours confused about things that a 20-minute video could've explained.
I started with blog posts, YouTube videos, and CTF writeups. My existing knowledge of JavaScript and V8's high-level architecture (compilation tiers, hidden classes, inline caches) helped me absorb the material faster, but even without that background, these resources are accessible:
- LiveOverflow's Browser Exploitation playlist - excellent introduction to V8 internals and exploitation concepts
- V8 Pwn - Type Confusion to RCE - walks through a full exploit chain
- ir0nstone's Browser Exploitation notes - concise reference for OOB exploitation in V8
After a few days of research, I felt ready to actually try the challenges. And here's the thing - the research paid off massively. Concepts that would've taken me hours to figure out through trial and error were already in my head when I needed them.
Setting Up the Debug Environment
If you want to hack something, you need a proper environment to make your exploit iteration as fast as possible and have access to source code for analysis.
Building V8 for Exploitation Research
My main machine is an Apple Silicon Mac, and the challenges target x86_64 Linux. V8's build system doesn't support macOS to Linux cross-compilation directly, so I set up a Docker environment with Rosetta that builds Linux x64 binaries, then transfer them to an emulated x64 VM (UTM with Ubuntu 24.04) for debugging.
The difference is massive: a full debug build directly inside the emulated VM takes ~6 hours on M3 Max. With Docker using Rosetta emulation, the same build takes ~20 minutes, and incremental rebuilds take 1-2 minutes.
I published the Docker setup as a repo: v8-docker-build. You provide the V8 revision, a patch file, and args.gn flags, and it outputs a d8 binary. You can also add debug logs inside the V8 source and rebuild with the --quick flag for better observability - very helpful when hunting JIT bugs.
Key GN build flags for exploit development:
is_debug=true                    # full debug symbols and assertions
v8_enable_disassembler=true      # --print-code support for inspecting JIT output
v8_enable_object_print=true      # detailed %DebugPrint() output
v8_enable_verify_heap=true       # heap verification
v8_enable_sandbox=false          # disable sandbox for simpler initial exploitation
To be honest, you probably won't need custom builds until the later challenges. The stock d8 binary already comes with great debugging capabilities like %DebugPrint, %OptimizeFunctionOnNextCall, etc.
d8 Debugging Tools
The d8 shell supports V8's native runtime functions when launched with --allow-natives-syntax. These are essential:
%DebugPrint(obj)                    // inspect any V8 object's internal fields
%SystemBreak()                      // trigger INT3 to drop into GDB
%OptimizeFunctionOnNextCall(fn)     // force synchronous TurboFan compilation
%NeverOptimizeFunction(fn)          // keep function in interpreter
You can also check what compilation tier a function is running at:
let status = %GetOptimizationStatus(fn)
// bit 1024 = Maglev, bit 65536 = TurboFan
GDB Setup
Set up the V8 GDB extension for the job command, which pretty-prints V8 heap objects inside GDB. Add this to your ~/.gdbinit:
source /path/to/v8/tools/gdbinit
Other useful flags for debugging:
rlwrap ./d8    # arrow keys and history in the d8 shell
d8 --trace-deopt              # see every deoptimization with reason
d8 --trace-turbo --trace-turbo-filter=vuln  # dump TurboFan IR graph for a specific function
V8 Internals: What You Need to Know
Coming from libc exploitation, there are a few V8-specific concepts that you need to internalize before the exploit techniques make sense.
Tagged and Compressed Pointers
This is the first big difference from regular libc exploitation. V8 tags pointers by setting the last bit to 1. So if your object's actual address is 0x00004320, V8 stores it as 0x00004321. When you %DebugPrint an object and get an address, always examine memory in GDB with:
x/16gx $ptr - 1
On top of tagging, V8 uses pointer compression. The entire V8 heap lives within a 4GB "cage," and most pointers are stored as 32-bit offsets from a base address kept in a register (r13 or r14 depending on context). So a full pointer like 0x001c00004320 is stored as just 0x00004321 (the lower 32 bits, tagged). V8 reconstructs the full address by adding the cage base.
This means you don't need to worry about the base address if your read/write primitives are based on V8 type confusion - you just work with tagged 32-bit compressed pointers and V8 handles the rest. But you do need to know the cage base when reading raw memory in GDB or when escaping the sandbox.
Float Arrays as the Universal Write Primitive
Another difference from regular libc exploitation: almost every 64-bit write in V8 exploits goes through float arrays. Since FixedDoubleArray stores raw IEEE 754 doubles (8 bytes per slot), writing a float value directly writes 8 raw bytes to memory. This means you need to convert your integer values to their float representation before writing:
// Helper: convert BigInt to float64
let buf = new ArrayBuffer(8);
let f64 = new Float64Array(buf);
let u64 = new BigUint64Array(buf);

function itof(val) { u64[0] = val; return f64[0]; }
function ftoi(val) { f64[0] = val; return u64[0]; }

// To write the integer 0xdeadbeef00000000 to memory:
float_arr[0] = itof(0xdeadbeef00000000n);
// V8 stores the raw IEEE 754 bytes, which are exactly our target integer
You'll use itof/ftoi constantly. In libc exploitation you think in integers and pack with p64(). In V8 exploitation you think in floats and pack with itof().
Maps: V8's Type System
Every heap object in V8 has a map as its first field. Think of it like the "prototype" in JavaScript, but at the engine level. The map tells V8 what type the object is, how its elements are stored, what properties it has, and how to access them.
For exploitation, the critical thing is how maps determine element storage:
PACKED_DOUBLE_ELEMENTS- backed by aFixedDoubleArray(8 bytes per slot, raw IEEE 754 floats)PACKED_ELEMENTS- backed by aFixedArray(4 bytes per slot, compressed tagged pointers)
A float array stores raw 8-byte doubles. An object array stores 4-byte compressed pointers. Same memory, completely different interpretation. Changing the map changes how V8 reads and writes the same backing store memory. This is the foundation of type confusion exploits.
Compilation Tiers
JavaScript goes through multiple compilation tiers in V8:
- Ignition - bytecode interpreter (no optimization)
- Maglev - mid-tier JIT (fast compilation, moderate optimization)
- TurboFan - top-tier optimizing JIT (aggressive optimization, speculative)
This matters because different tiers have different security checks. A vulnerability in TurboFan's optimization passes may not be triggerable in Maglev, and vice versa. Forcing a specific tier requires explicit control:
// Force TurboFan compilation (synchronous)
%OptimizeFunctionOnNextCall(vuln);
vuln();

// Natural optimization only reaches Maglev from hot loops
for (let i = 0; i < 100000; i++) vuln();
Gotcha: File vs. REPL Behavior
This one bit me. Code behaves differently in a .js file vs. the d8 REPL. Each REPL line compiles as a separate script, while a file is one compilation unit. TurboFan compiles on a background thread - in a file, your exploit code may run before TurboFan finishes, using Maglev code instead. The REPL's line-by-line execution gives the background compiler more time to finish.
In one of the challenges my exploit worked perfectly under GDB but not in a real shell. After digging I realized GDB slows execution because of all the ptrace API intercepting, giving TurboFan enough time to optimize my function. In the real shell, the main thread reached the exploit code before TurboFan was done.
Fix: use %OptimizeFunctionOnNextCall() for synchronous compilation (in debug mode), or add busy-wait loops to give the background compiler time:
%OptimizeFunctionOnNextCall(vuln);
vuln();  // this call triggers synchronous TurboFan compilation

// alternative: busy-wait if you can't use natives syntax
for (let i = 0; i < 1e8; i++) {}
The Core Primitives
As it turns out, all the challenges lead to building four main primitives:
- addrof - get the address of a JavaScript object
- fakeobj - construct a fake JavaScript object at an arbitrary address (this is like FSOP from libc)
- arb_read - read any address (built on top of fakeobj)
- arb_write - write to any address (built on top of fakeobj)
Of course, the difficulty is getting these primitives with limited control - sometimes you only have a single out-of-bounds read or write. That's where creative thinking comes in. But once you have arbitrary read/write, the endgame is straightforward.
addrof and fakeobj via Type Confusion
The fundamental exploit technique in V8 exploits the size mismatch between double arrays and object arrays. Remember: a double array stores 8-byte IEEE 754 values, while an object array stores 4-byte compressed pointers. Same memory, different interpretation.
addrof(obj) - leak the compressed pointer of a JS object:
// Assume we can swap a double array's map to an object array map (via a bug)
obj_arr[0] = target_obj;           // store object as tagged pointer (4 bytes)
// swap obj_arr's map -> float_arr map
let leak = float_arr_view[0];      // read same memory as float64 (8 bytes)
let addr = ftoi(leak) & 0xFFFFFFFFn;  // low 32 bits = compressed pointer
fakeobj(addr) - make V8 treat an arbitrary address as an object:
// Write a double whose low 32 bits are the target compressed address
float_arr[0] = itof(addr);
// swap float_arr's map -> obj_arr map
let fake = obj_arr_view[0];        // V8 reads bits as a compressed pointer
// fake is now a "JS object" at addr
The key insight: you're not converting between types. You're making V8 misinterpret the same raw bytes by lying about the array's element kind.
From fakeobj to Arbitrary Read/Write
Once you have fakeobj, you can create a fake JSArray whose internal fields overlay a controlled double array's elements:
arb_rw_arr:
  [0] -> fake object's map         (set to a valid float array map)
  [1] -> fake object's elements    (CONTROLLED - this is the target address)

Read/write through fake[0] accesses whatever address you set as elements.
By writing to arb_rw_arr[1], you control where the fake array's elements pointer points. Then reading or writing fake[0] accesses that arbitrary address.
One important detail: all heap pointers have bit 0 set (tag = 1). V8 subtracts 1 before dereferencing. When computing the elements pointer for arbitrary access, you need target_addr - 7 (not -8), because V8 does elements - 1 + 8 = elements + 7 to reach the first element (skipping the FixedArray header).
Getting Code Execution
After having arbitrary read/write, the endgame in V8 exploitation is refreshingly simple compared to libc. No ROP chains, no FSOP, no stack pivoting. Here's why:
When you create a WebAssembly instance, V8 allocates an RWX page (read-write-execute) for the compiled Wasm code. Your exported Wasm function's code lives on this page.
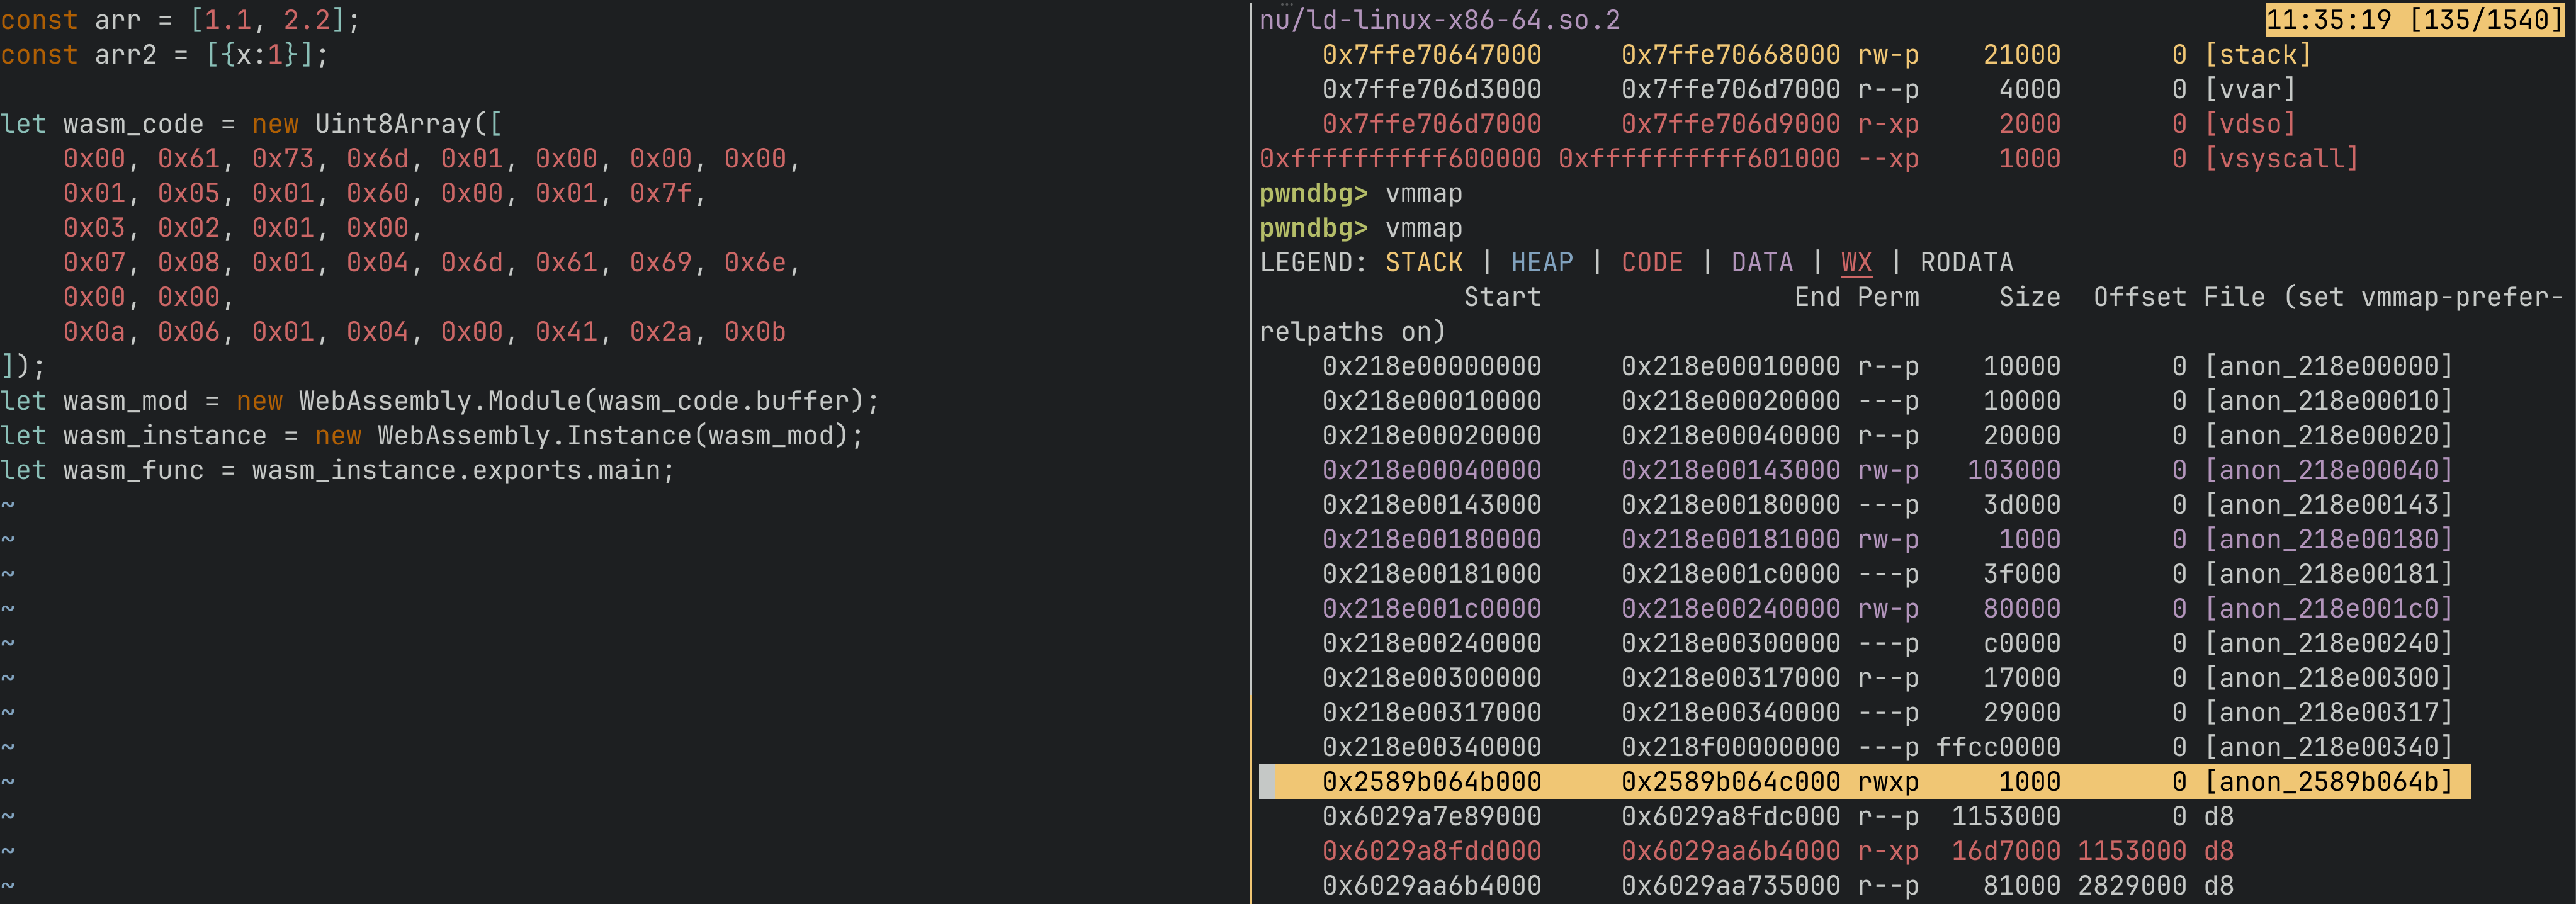
So the plan is:
- Create a Wasm instance with a dummy function
- Find the RWX page address (via
arb_readon V8 internal structures) - Overwrite the Wasm code with your shellcode (via
arb_write) - Call the Wasm function - it jumps to the RWX page and executes your shellcode
// 1. Create Wasm instance with a trivial function
let wasm_code = new Uint8Array([
  0x00, 0x61, 0x73, 0x6d, 0x01, 0x00, 0x00, 0x00,
  // ... minimal valid Wasm module with one exported function
]);
let wasm_mod = new WebAssembly.Module(wasm_code);
let wasm_instance = new WebAssembly.Instance(wasm_mod);
let f = wasm_instance.exports.main;

// 2. Leak RWX page address from Wasm internal structures
let rwx_addr = arb_read(/* WasmInternalFunction code entry */);

// 3. Write shellcode to the RWX page
let shellcode = [/* execve("/bin/sh", ...) bytes */];
for (let i = 0; i < shellcode.length; i++) {
  arb_write(rwx_addr + i, shellcode[i]);
}

// 4. Call the function - executes shellcode
f();
That's it. No need for the elaborate techniques you'd use in libc exploitation. The RWX page gives you a direct path from arbitrary write to code execution.
Exploit Iteration Speed
This is something I wouldn't have initially expected to be such a big advantage over libc or VM exploitation, but it's huge.
With d8 under pwndbg, reloading the exploit is just:
r --allow-natives-syntax --shell exploit.js
Your new exploit code is loaded and executed, with a bonus REPL shell and all d8 debugging tools for manual inspection. Compare this to QEMU exploitation where I'd wait 1-2 minutes for the environment to boot and the exploit to run. In V8, a full reload takes under a second, plus you get the interactive REPL to poke at things.
The development loop is basically:
- Edit
exploit.jsin your editor - Hit
rin pwndbg - Inspect with
%DebugPrint,job, breakpoints - Repeat
What Comes Next: Sandbox and Beyond
The challenges I described so far assume v8_enable_sandbox=false. Modern V8 (post ~v11.7) implements a memory sandbox that constrains where pointers can reach:
- Sandboxed pointers: ArrayBuffer backing stores are stored as shifted offsets from the sandbox base, not raw pointers. They can only reference addresses within a 1TB sandbox region.
- External Pointer Table (EPT): For pointers that must reach outside the sandbox (code entry points, foreign addresses), V8 uses an indirection table. Objects store a table index; the table entry holds the real pointer XORed with a type-specific tag.
Bypassing the sandbox requires finding the EPT within the sandbox region and manipulating its entries to redirect code execution. The Wasm jump table entries on RWX pages become the target - overwrite them to point at your shellcode. Another approach is finding full (unsandboxed) pointers inside Wasm module internals that you can overwrite - some internal fields store raw 64-bit pointers that V8 trusts as-is, and redirecting them gives you an unsandboxed write primitive straight to the RWX page. This was the technique I used for the sandbox escape challenges.
These are more advanced topics that deserve their own posts. But the fundamentals covered above - the debug environment, the mental model for maps and type confusion, the four core primitives - are the foundation everything else builds on.
Takeaways
- V8/Browser exploitation isn't that scary if you already have pwn knowledge. The concepts are different but the mindset is the same. If you can exploit a heap UAF in glibc, you can learn to exploit a type confusion in V8.
- Research first, then act. A few days of reading and watching videos saved me weeks of confused debugging. The V8 internals are well-documented if you know where to look.
- Have a proper debug environment you can control. This is an absolute necessity for the cases when your exploit doesn't work and you don't know why (though you're sure it should).
- Always build primitives. Having well-defined addrof/fakeobj/arb_read/arb_write functions makes it easy to migrate exploit code between environments - from d8 shell to browser, from one challenge to the next.
- Verify heap layout with
%DebugPrint. Offsets change between V8 versions. Never assume - always check.
Resources
- LiveOverflow's Browser Exploitation playlist - start here
- V8 Pwn - Type Confusion to RCE - full exploit walkthrough
- ir0nstone's Browser Exploitation notes - CTF V8 OOB write-up
- pwn.college V8 exploitation challenges - the challenges I solved
- v8-docker-build - Docker environment for building V8 on Apple Silicon